Analysing a time series#
To examine how the genetic diversity of the population changes over time, we need to make observations at multiple time points.
We construct a list (or a range) of observation times. This is recorded in backwards time, so that observation time = 0 is the present or most recent generation in the population history.
We pass this to
get_coalescentwhich launches a Markov chain simulation of coalescence times at each observation time point.When we run
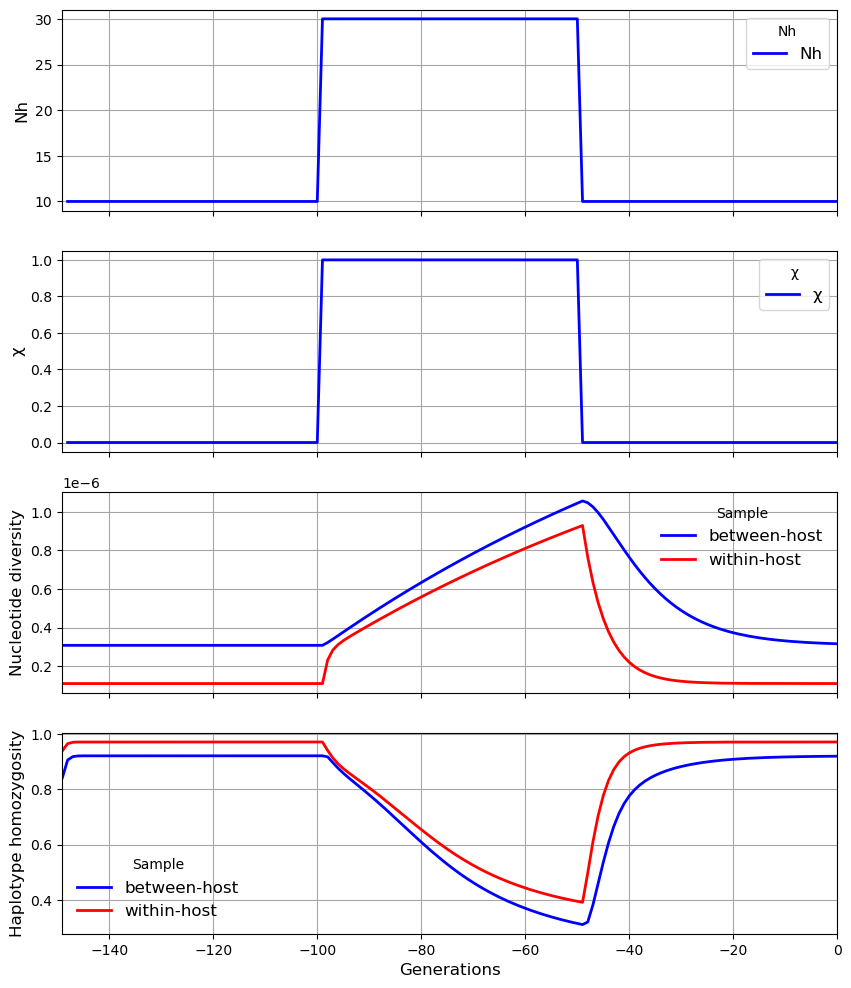
get_diversityit automatically calculates nucleotide diversity and haplotype homozygosity at each observation time point.We can use
plot_observationsto view the time series data
Thus if we specify 100 observation times, this will require 100 simulations, which will take much longer (typically several minutes for a population size of several thousands) than a single observation (typically several seconds).
get_diversity starts with the earliest observation and proceeds to the most recent generation. The effective recombination parameter \(\phi\) is updated with each observation, so that more recent generations are likely to have a more accurate estimate of \(\phi\) than earlier observations.
!pip install coalestr
from coalestr import cs
my_history = [[300, 10, 5, 0, 1],
              [50, 30, 5, 1, 1],
              [50, 10, 5, 0, 1]]

my_population = cs.Population(my_history)

# We specify observation times as a list or a range
my_observations = range(0, 150, 1)

# We pass the observation times to get_coalescent
my_population.get_coalescent(observe = my_observations, show = False)

# get_diversity automatically analyses each observation time
my_population.get_diversity(show = False)

# use plot_observations to view the time series data
my_population.plot_observations(metrics = ("N", "X", "snp_het", "hap_hom"))


