A local outbreak#
Here we model a local outbreak of malaria under a number of different scenarios.
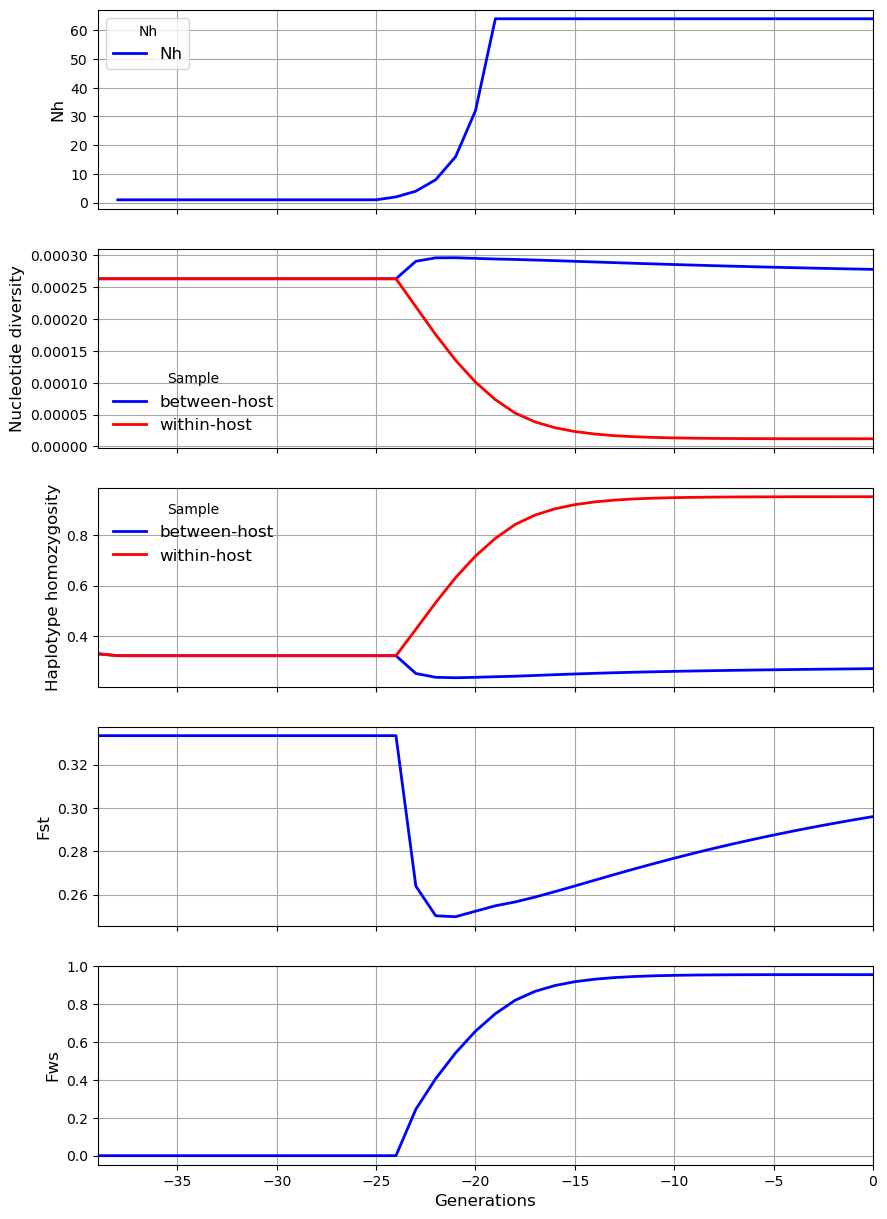
In the first scenario we start off with \(N_h = 1\) and \(N_m = 1\), i.e. there is initially no local reservoir of infection and all malaria infections are imported from the global metapopulation. The outbreak is characterised by an exponential increase in \(N_h\). Paradoxically this leads to a decrease in nucleotide diversity \(\pi_S\) and an increase in the inbreeding coefficient \(F_{WS}\), because \(N_m\) is constant so the rise in \(N_h\) causes \(m\) to decline, and this reduction in the proportion of hosts that have migrated from the metapopulation acts to reduce local levels of diversity.
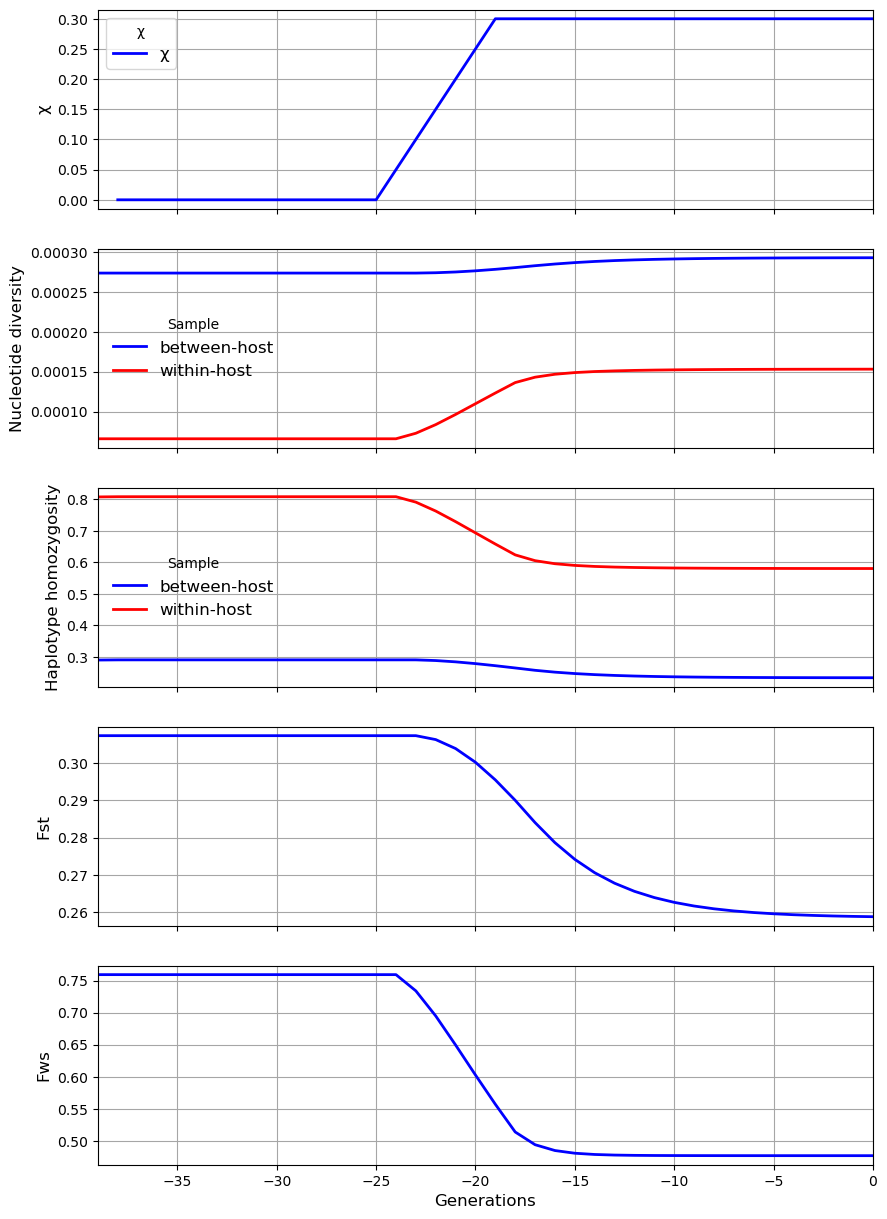
In the second scenario there is an increase in \(\chi\). This causes an increase in within-host nucleotide diversity \(\pi_W\) and a reduction in the inbreeding coefficient \(F_{WS}\).
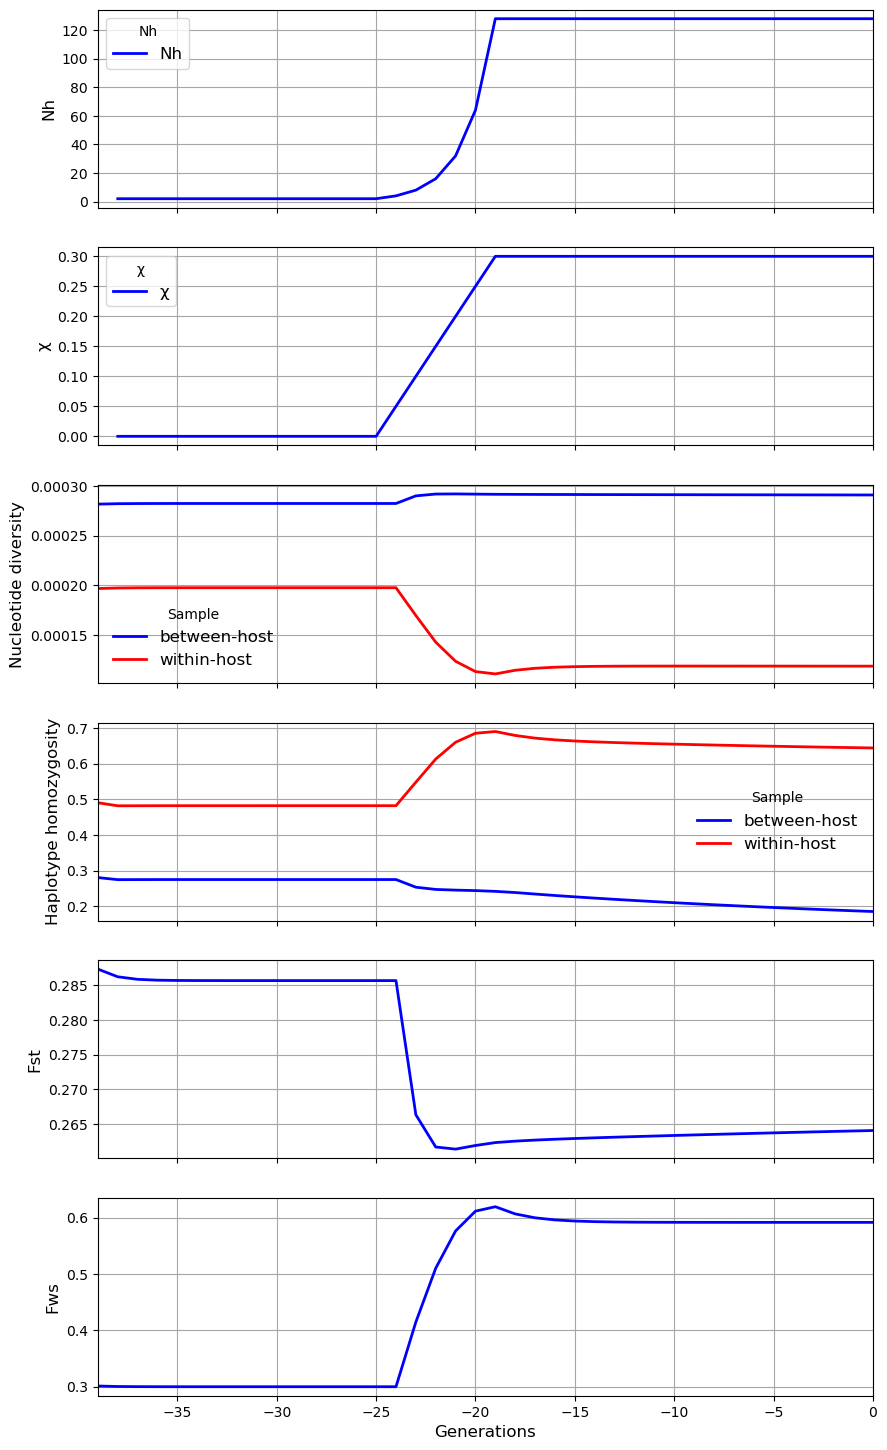
In the third scenario, there is an increase in both \(N_h\) and \(\chi\). In this example the effects of the increase in \(N_h\) dominate the genetic landscape.
!pip install coalestr
from coalestr import cs
my_species = cs.species()
my_species.get_coalescent(show = False)
my_species.get_diversity(show = False)
history = [[200, 1, 3, 0, 1],
           [1, 2, 3, 0, 1],
           [1, 4, 3, 0, 1],
           [1, 8, 3, 0, 1],
           [1, 16, 3, 0, 1],
           [1, 32, 3, 0, 1],
           [20, 64, 3, 0, 1]]

observe = range(40)

my_village = cs.Population(history, metapopulation = my_species)
my_village.get_coalescent(observe, show = False)
my_village.get_diversity(show = False)
my_village.plot_observations(metrics = ("Nh", "snp_het", "hap_hom", "Fst", "Fws"))

history = [[200, 10, 3, 0, 1],
           [1, 10, 3, 0.05, 1],
           [1, 10, 3, 0.1, 1],
           [1, 10, 3, 0.15, 1],
           [1, 10, 3, 0.2, 1],
           [1, 10, 3, 0.25, 1],
           [20, 10, 3, 0.3, 1]]

observe = range(40)

my_village = cs.Population(history, metapopulation = my_species)
my_village.get_coalescent(observe, show = False)
my_village.get_diversity(show = False)
my_village.plot_observations(metrics = ("chi", "snp_het", "hap_hom", "Fst", "Fws"))

history = [[20, 2, 3, 0, 1],
           [1, 4, 3, 0.05, 1],
           [1, 8, 3, 0.1, 1],
           [1, 16, 3, 0.15, 1],
           [1, 32, 3, 0.2, 1],
           [1, 64, 3, 0.25, 1],
           [20, 128, 3, 0.3, 1]]

observe = range(40)

my_village = cs.Population(history, metapopulation = my_species)
my_village.get_coalescent(observe, show = False)
my_village.get_diversity(show = False)
my_village.plot_observations(metrics = ("Nh", "chi", "snp_het", "hap_hom", "Fst", "Fws"))


