Rate of superinfection#
The rate of superinfection \(\chi\), also known as the crossing rate of transmission chains, is one of the key parameters of the genomic transmission graph. \(\chi\) is related to the inbreeding coefficient \(F_{WS}\) which can be measured by deep sequencing of parasites taken from malaria-infected individuals:

where \(\widehat{H}_W\) is mean within-host heterozygosity and \(H_S\) is the heterozygosity of the subpopulation.
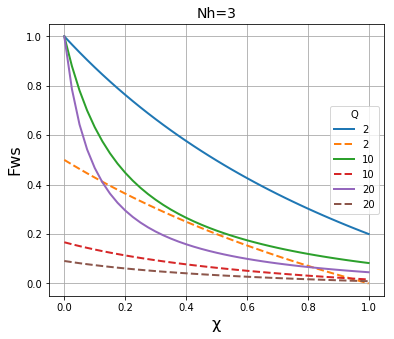
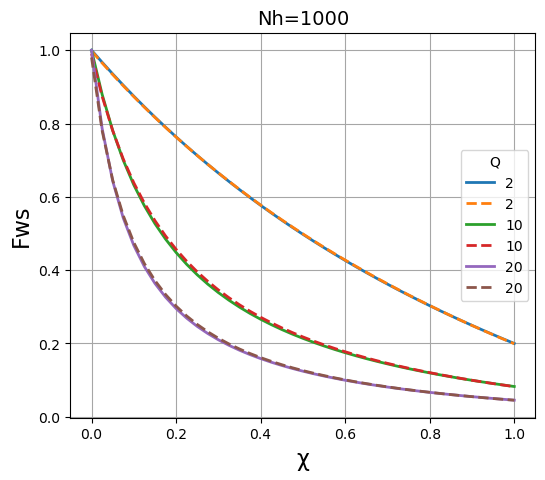
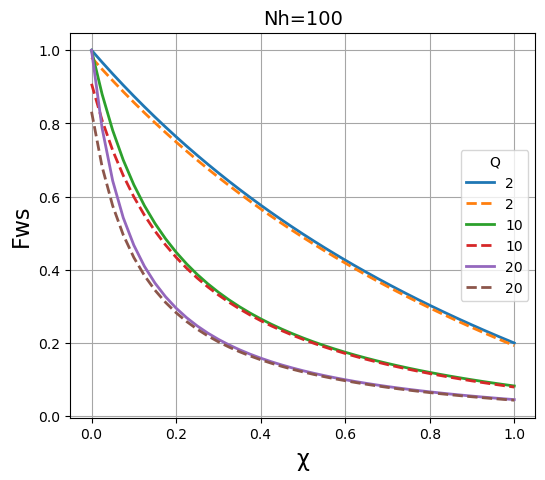
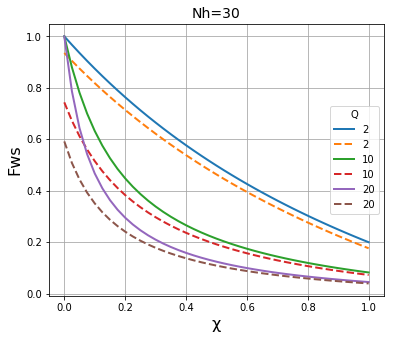
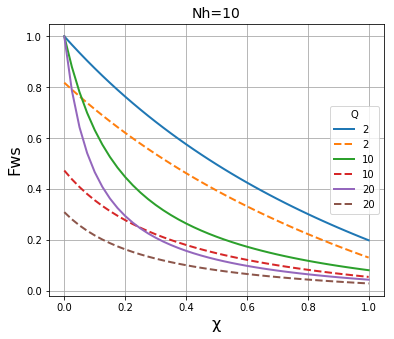
Here we examine the relationship between \(\chi\) and \(F_{WS}\) using two different methods. In both cases we estimate \(F_{WS}\) for various combinations of transmission parameters and then plot the relationship with \(\chi\).
The first method estimates times to coalescence by Markov chain simulation and then estimates levels of heterozygosity within-host and in the subpopulation. We can do this using the get_coalescent() and get_diversity() functions in coalestr. This automatically calculates \(F_{WS}\) and returns it as an attribute of the population.
The second method uses the formula for the linear relationship between \(H_W\) and \(H_S\)

\(\lambda\) is very small so for most practical purposes we can say that \(F_{WS} = 1 - \kappa\).
We then plot the results of both methods on the same graph to compare the results. It is apparent that the two methods give essentially identical results \(N_h\) is large (~1000), and are fairly close when \(N_h\) is in the region of 100, but that they deviate significantly when \(N_h\) is in the region of 30 or below.
!pip install coalestr

from coalestr import cs
import matplotlib.pyplot as plt
mu = 1.1e-8 # Mutation rate
duration = 10000
N = 1000

X_list = [x/40 for x in range(41)] # values of chi to estimate
Q_list = [2, 10, 20]

plt.figure(figsize = (6,5))

for Q in Q_list:

    alpha = (1 - 1 / Q) * (1 - 2 * mu)
    fws_formula = []
    fws_simulation = []
    X_plot = []

    for X in X_list:

        # get result by simulation
        history = [[duration, N, Q, X, 0]]
        pop = cs.Population(history)
        pop.get_coalescent(show = False)
        pop.get_diversity(show = False)
        fws_simulation_result = pop.diversity[0, 5]
        fws_simulation.append(fws_simulation_result)

        # get result by formula
        sum1 = 0
        sum2 = X
        for i in range(1,10000):
            sum1 += Q * X * (1 - X) ** (i - 1) / ( 2 * Q - (Q - 1) * alpha ** i - 1)
            sum2 += X * (1 - X) ** i * alpha ** i
        fws_formula_result = 1 - sum1 * sum2
        fws_formula.append(fws_formula_result)

    plt.plot(X_list, fws_formula, linewidth=2, label=Q)
    plt.plot(X_list, fws_simulation, linestyle = 'dashed', linewidth=2, label=Q)

plt.title("Nh=" + str(N), fontsize=14)
plt.xlabel("\u03C7", fontsize=16)
plt.ylabel("Fws", fontsize=16)
plt.grid(visible=True, which='both', color='0.65', linestyle='-')
plt.legend(title="Q", frameon=True,loc=7)

plt.show()
duration = 10000
N = 100

X_list = [x/40 for x in range(41)] # values of chi to estimate
Q_list = [2, 10, 20]

plt.figure(figsize = (6,5))

for Q in Q_list:

    alpha = (1 - 1 / Q) * (1 - 2 * mu)
    fws_formula = []
    fws_simulation = []
    X_plot = []

    for X in X_list:

        # get result by simulation
        history = [[duration, N, Q, X, 0]]
        pop = cs.Population(history)
        pop.get_coalescent(show = False)
        pop.get_diversity(show = False)
        fws_simulation_result = pop.diversity[0, 5]
        fws_simulation.append(fws_simulation_result)

        # get result by formula
        sum1 = 0
        sum2 = X
        for i in range(1,10000):
            sum1 += Q * X * (1 - X) ** (i - 1) / ( 2 * Q - (Q - 1) * alpha ** i - 1)
            sum2 += X * (1 - X) ** i * alpha ** i
        fws_formula_result = 1 - sum1 * sum2
        fws_formula.append(fws_formula_result)

    plt.plot(X_list, fws_formula, linewidth=2, label=Q)
    plt.plot(X_list, fws_simulation, linestyle = 'dashed', linewidth=2, label=Q)

plt.title("Nh=" + str(N), fontsize=14)
plt.xlabel("\u03C7", fontsize=16)
plt.ylabel("Fws", fontsize=16)
plt.grid(visible=True, which='both', color='0.65', linestyle='-')
plt.legend(title="Q", frameon=True,loc=7)

plt.show()
duration = 10000
N = 30

X_list = [x/40 for x in range(41)] # values of chi to estimate
Q_list = [2, 10, 20]

plt.figure(figsize = (6,5))

for Q in Q_list:

    alpha = (1 - 1 / Q) * (1 - 2 * mu)
    fws_formula = []
    fws_simulation = []
    X_plot = []

    for X in X_list:

        # get result by simulation
        history = [[duration, N, Q, X, 0]]
        pop = cs.Population(history)
        pop.get_coalescent(show = False)
        pop.get_diversity(show = False)
        fws_simulation_result = pop.diversity[0, 5]
        fws_simulation.append(fws_simulation_result)

        # get result by formula
        sum1 = 0
        sum2 = X
        for i in range(1,10000):
            sum1 += Q * X * (1 - X) ** (i - 1) / ( 2 * Q - (Q - 1) * alpha ** i - 1)
            sum2 += X * (1 - X) ** i * alpha ** i
        fws_formula_result = 1 - sum1 * sum2
        fws_formula.append(fws_formula_result)

    plt.plot(X_list, fws_formula, linewidth=2, label=Q)
    plt.plot(X_list, fws_simulation, linestyle = 'dashed', linewidth=2, label=Q)

plt.title("Nh=" + str(N), fontsize=14)
plt.xlabel("\u03C7", fontsize=16)
plt.ylabel("Fws", fontsize=16)
plt.grid(visible=True, which='both', color='0.65', linestyle='-')
plt.legend(title="Q", frameon=True,loc=7)

plt.show()
duration = 10000
N = 10

X_list = [x/40 for x in range(41)] # values of chi to estimate
Q_list = [2, 10, 20]

plt.figure(figsize = (6,5))

for Q in Q_list:

    alpha = (1 - 1 / Q) * (1 - 2 * mu)
    fws_formula = []
    fws_simulation = []
    X_plot = []

    for X in X_list:

        # get result by simulation
        history = [[duration, N, Q, X, 0]]
        pop = cs.Population(history)
        pop.get_coalescent(show = False)
        pop.get_diversity(show = False)
        fws_simulation_result = pop.diversity[0, 5]
        fws_simulation.append(fws_simulation_result)

        # get result by formula
        sum1 = 0
        sum2 = X
        for i in range(1,10000):
            sum1 += Q * X * (1 - X) ** (i - 1) / ( 2 * Q - (Q - 1) * alpha ** i - 1)
            sum2 += X * (1 - X) ** i * alpha ** i
        fws_formula_result = 1 - sum1 * sum2
        fws_formula.append(fws_formula_result)

    plt.plot(X_list, fws_formula, linewidth=2, label=Q)
    plt.plot(X_list, fws_simulation, linestyle = 'dashed', linewidth=2, label=Q)

plt.title("Nh=" + str(N), fontsize=14)
plt.xlabel("\u03C7", fontsize=16)
plt.ylabel("Fws", fontsize=16)
plt.grid(visible=True, which='both', color='0.65', linestyle='-')
plt.legend(title="Q", frameon=True,loc=7)

plt.show()
duration = 10000
N = 3

X_list = [x/40 for x in range(41)] # values of chi to estimate
Q_list = [2, 10, 20]

plt.figure(figsize = (6,5))

for Q in Q_list:

    alpha = (1 - 1 / Q) * (1 - 2 * mu)
    fws_formula = []
    fws_simulation = []
    X_plot = []

    for X in X_list:

        # get result by simulation
        history = [[duration, N, Q, X, 0]]
        pop = cs.Population(history)
        pop.get_coalescent(show = False)
        pop.get_diversity(show = False)
        fws_simulation_result = pop.diversity[0, 5]
        fws_simulation.append(fws_simulation_result)

        # get result by formula
        sum1 = 0
        sum2 = X
        for i in range(1,10000):
            sum1 += Q * X * (1 - X) ** (i - 1) / ( 2 * Q - (Q - 1) * alpha ** i - 1)
            sum2 += X * (1 - X) ** i * alpha ** i
        fws_formula_result = 1 - sum1 * sum2
        fws_formula.append(fws_formula_result)

    plt.plot(X_list, fws_formula, linewidth=2, label=Q)
    plt.plot(X_list, fws_simulation, linestyle = 'dashed', linewidth=2, label=Q)

plt.title("Nh=" + str(N), fontsize=14)
plt.xlabel("\u03C7", fontsize=16)
plt.ylabel("Fws", fontsize=16)
plt.grid(b=True, which='both', color='0.65', linestyle='-')
plt.legend(title="Q", frameon=True,loc=7)

plt.show()
