Create a Population#
The first step in using coalestr is to specify the transmission history of the parasite population that we want to simulate. The simplest way to format this is as a list of lists:
my_history = [[D, N, Q, X, M], [D, N, Q, X, M], [D, N, Q, X, M]]
Each inner list gives the transmission parameters for a period of population history. The first inner list describes the transmission parameters for the first period, the second inner list describes the second period, and so on. In this example there are three periods of population history, but we can expand this to as many periods as we like. For more complex transmission histories we can use an array instead of a list of lists, as described at the bottom of this page.
Each period of population history is described by five variables:
D- duration of the period in generationsN- effective number of hosts \(N_h\)Q- quantum of transmission \(Q\)X- crossing rate of transmission chains \(\chi\)M- migration rate from a metapopulation \(N_m\).
For a simple population without migration M is zero. It is non-zero only if this is a subpopulation that receives migrants from a larger metapopulation as described elsewhere.
We create a simple population without migration like this:
my_population = coalestr.Population(my_history)
This creates an instance of the Population class called my_population with the given set of transmission parameters.
!pip install coalestr
from coalestr import cs
''' We specify the transmission history as a list of lists
Each inner list corresponds to a period of history ..
.. and has the format [duration, N, Q, X, M]
In this case there are three periods each of 1000 generations '''

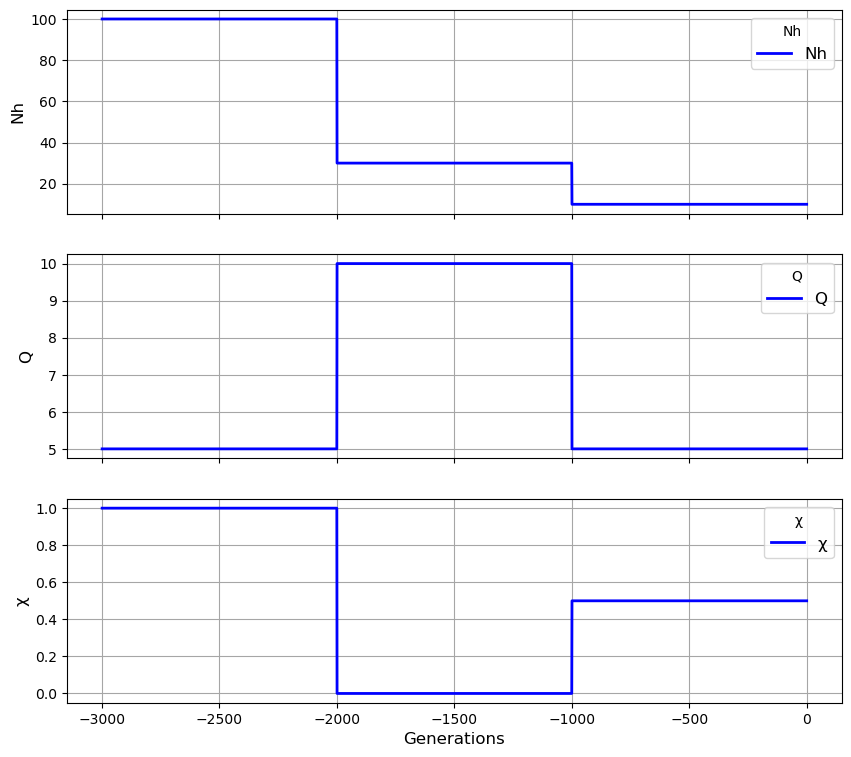
my_history = [[1000, 100, 5, 1, 0], [1000, 30, 10, 0, 0], [1000, 10, 5, 0.5, 0]]

# We use the history to create an instance of the Population class:

my_population = cs.Population(my_history)

# We can visualise the transmission history:

my_population.plot_history()

Population attributes#
Each population has a set of attributes when it is first created, such as rates of mutation and recombination. These are assigned the default values listed below, but they can be modified at any stage.
mu= 1.1e-8 (single nucleotide substitution rate)r= 7.4e-4 (locus scaled recombination rate per kb)v= 9e-5 (locus scaled mutation rate per kb)locus_kb= 27 (length of haplotype locus in kb)phi_seed= 0.2 (initialise effective recombination parameter \(\phi\))
t_his is the total duration of the population history.
A population also acquires attributes after it is created, such as rates of coalescence and levels of genetic diversity. These are generated when we invoke the get_coalescent and get_diversity methods, as described later.
# What is the total duration of the population history?

my_population.t_his
3000
# What is the single nucleotide substition rate of my_population?

my_population.mu
1.1e-08
# What is the locus scaled recombination rate of my_population?

my_population.r
0.00074
# Show all the population settings

my_population.show_settings()
mu 1.100e-08,
r 7.400e-04,
v 9.000e-05,
locus_kb 27.00
unit_length 13.50,
chromosome_length 100,
minimum_length 2
# Modify the mutation and recombination rates

my_population.mu = 5e-07
my_population.r = 6.3e-03

# Check the new values

my_population.show_settings()
mu 5.000e-07,
r 6.300e-03,
v 9.000e-05,
locus_kb 27.00
unit_length 13.50,
chromosome_length 100,
minimum_length 2
# Restore the default settings

my_population.restore_settings()
my_population.show_settings()
mu 1.100e-08,
r 7.400e-04,
v 9.000e-05,
locus_kb 27.00
unit_length 13.50,
chromosome_length 100,
minimum_length 2
Population methods#
Once we have created a population (like my_population) we can invoke various methods to do useful things with it. These include simple descriptors of the population such as plot_history and show_settings as demonstrated above.
Most importantly there are methods:
to perform a coalescent simulation using
get_coalescentto obtain nucleotide diversity and haplotype homozygosity using
get_diversity
When we invoke get_coalescent and get_diversity we generate data arrays that become attributes of our population, e.g. describing how rates of coalescence and genetic diversity vary over time. We discuss these elsewhere.
Complex transmission histories#
'''For more complex transmission histories
that cannot be easily represented by a list of lists
we can instead create an array of transmission parameters
where axis 0 represents forward time '''

import numpy
import math

duration_of_simulation = 100
my_history = numpy.ones((duration_of_simulation, 4))

N = 100 # Nh baseline
Q = 10  # Q baseline
X = 0.5 # chi baseline
M = 0

for t in range(duration_of_simulation):

    my_history[t, 0] = N * (1 + 0.2 * math.sin(t))
    my_history[t, 1] = Q * (1 + 0.5 * math.cos(0.3 * t))
    my_history[t, 2] = X * (1 + 0.5 * math.sin(0.8 * t))
    my_history[t, 3] = M

    N += 20

# We create a population with this transmission history

my_population = cs.Population(my_history)

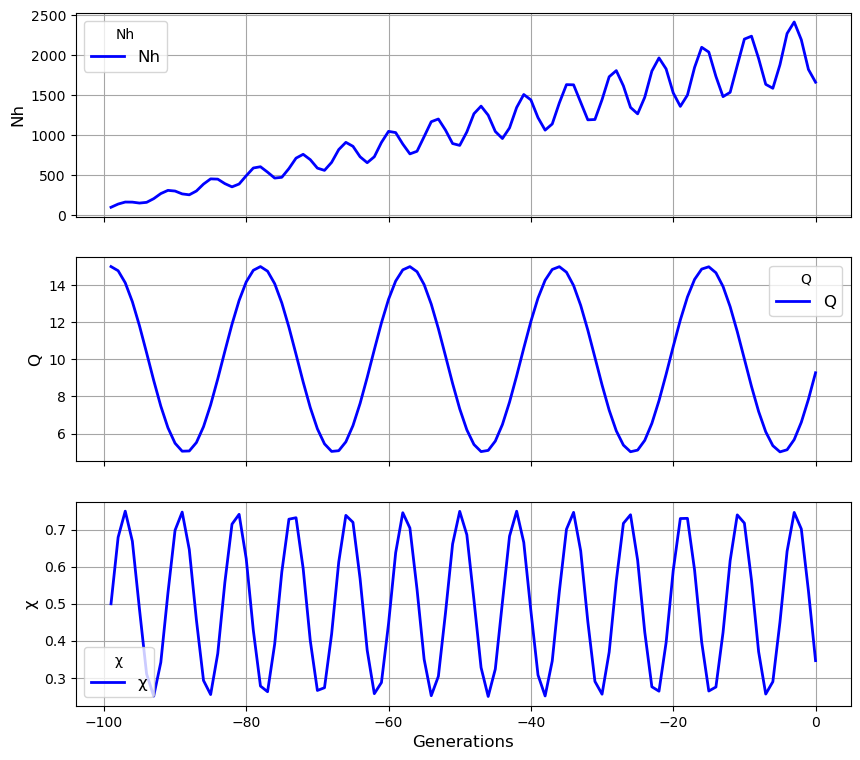
# We plot the transmission history

my_population.plot_history()


